Prediction of Hot Cracking Susceptibility of an Al-Cu-Mg Alloy
Purpose: Learn to perform solidification simulation to predict the hot cracking susceptibility index of an alloy in PanSolidification Module.
Module: PanSolidification
Thermodynamic and Mobility Database: PanAl_TH+MB.pdb
Kinetic Parameters Database: Al_Alloys.sdb
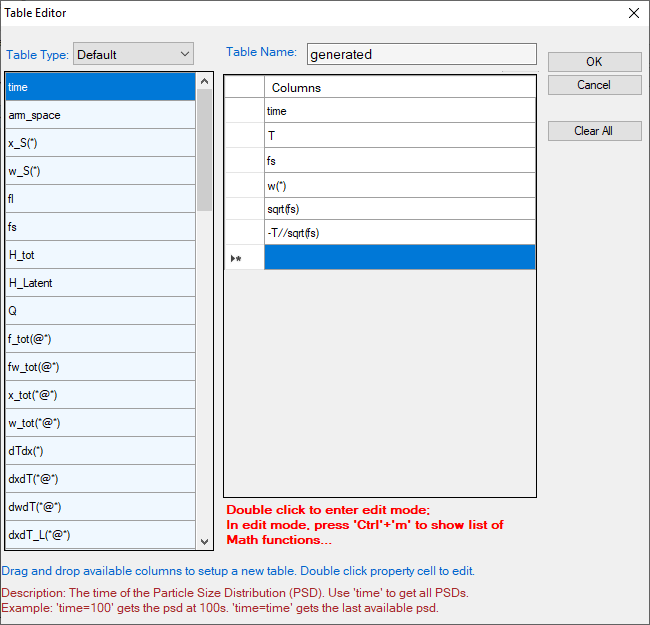
Note: In Pandat™ 2022 version, the property CSI is defined as "-T//sqrt(fs)". In the "Table editor" window, users can directly select CSI or simply type in CSI rather than using the math operation of "-T//sqrt(fs)".
Hot tearing or hot cracking is a serious defect occurred in welding and casting solidification. Cracking usually generated at the end stage of solidification along grain boundaries. Prof. Kou [2005Kou] proposed a criterion to describe the crack susceptibility by using a simple crack susceptibility index (CSI), which is the maximum value of |dT/d(fs)1/2| at (fs)1/2 < 0.99. The CSI criterion has been successfully applied in several Al alloy systems. In this example, users will learn how to perform solidification simulation of an Al-Cu-Mg alloy and output the relationship of |dT/d(fs)1/2| vs (fs)1/2 directly from Pandat™, and thus determine the CSI value of the alloy. Users will also learn to set extra output tables with some specified properties and extra output plots from this example. Commercial database of PanAl_TH+MB.pdb including the thermodynamic and mobility data is required to perform the calculation of this example.
Calculation Procedures:
-
Create a workspace and select the PanSolidification module following Pandat User's Guide: Workspace;
-
Load PanAl_TH+MB.pdb through menu "Database → Load TDB or PDB" or by click icon
 , and then select Al, Cu and Mg three components;
 -
Load SDB file Al_Alloys.sdb through menu "PanSolidification → Load SDB" or by click icon
 , select the available alloys: Al alloys.
 -
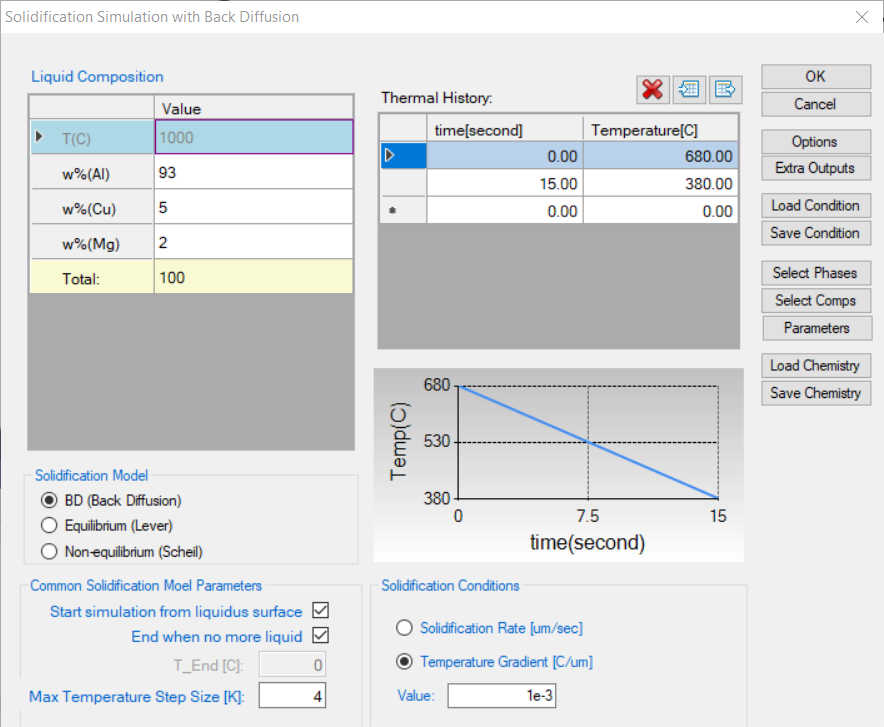
Set Solidification simulation conditions as shown in Figure 1. The alloy composition is Al-5wt.%Cu-2wt.%Mg. The cooling rate is 20 K/s is setting in Thermal History solidifying from 680 °C to 380 °C with 15 second. Temperature gradient is set as 10-3 °C/μm. Please pay attention to the units of the time and length when set conditions.
-
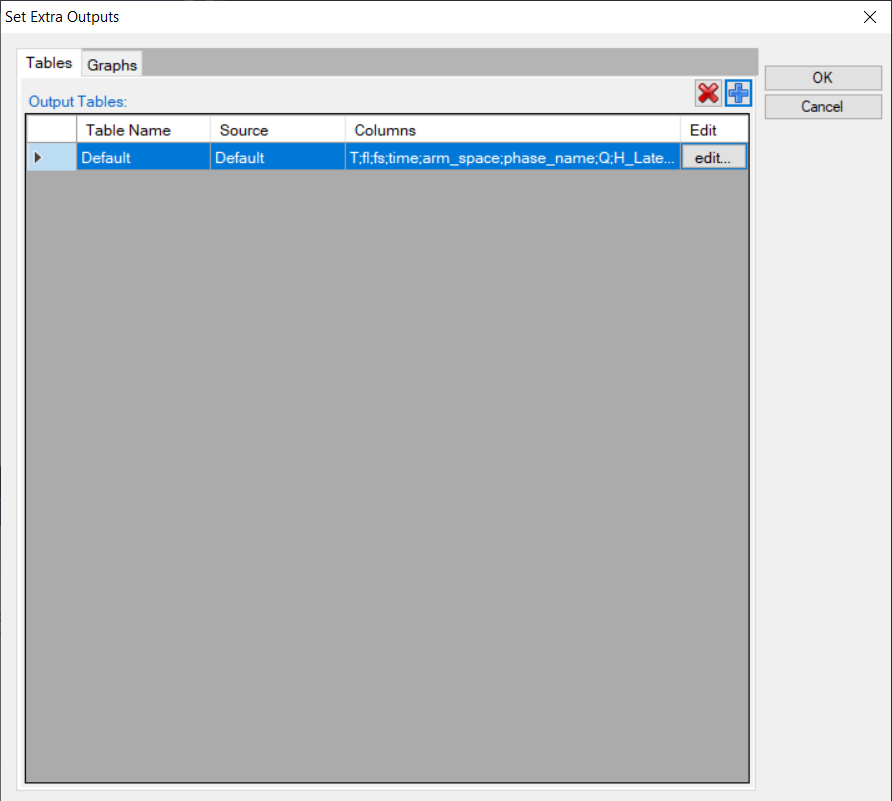
Set “Extra Outputs table”. Click the “Extra Outputs” in Figure 1, a new interface as shown in Figure 2 will appear. Click the blue “+” symbol in Figure 2 to pop out the Table Editor as shown in Figure 3. From this Table Editor, users can specify and type in properties to output, such as sqrt(fs), -T//sqrt(fs) in this example. -T//sqrt(fs) refers to -dT/d(fs)1/2, as the syntax // means derivative in Pandat™ software. Note that with this setting, a “generated” table will be created in addition to the Default table (In Pandat 2022, the CSI property is introduced to replace the "-T//sqrt(fs)".)
-
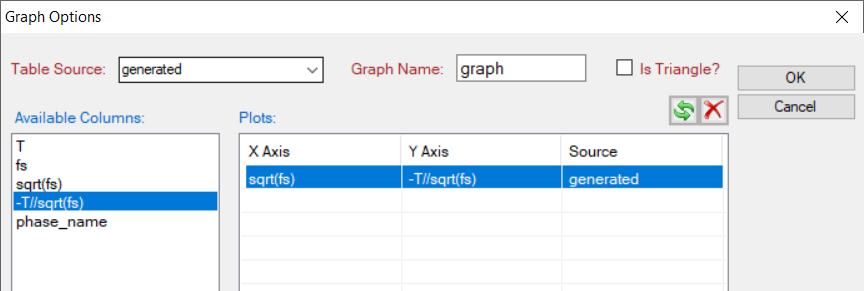
Set “Extra Outputs graph”. Click the icon “Graph” in “Set extra output” interface as shown in Figure 2, then click the blue “+” symbol to add extra Graph. An interface as shown in Figure 4 will appear. Select the “generated” table generated by the previous step. Drag sqrt(fs) from the left column to X axis in the right column; drag -T//sqrt(fs) from the left column to Y axis in the right column. Then click OK. Note that with this setting, a “graph” of -T//sqrt(fs) vs. sqrt(fs) will be plotted automatically in addition to the Default graph.
-
Then Click OK to perform Solidification simulation. (Detailed description also in Pandat User's Guide: Tutorial ).
Post Calculation Operation:
-
The default plot presents the relationship between fraction of solid (fs) and temperature during solidification as shown in Figure 5.
-
The extra graph specified is plotted automatically as shown in Figure 6.
-
Rescale Figure 6. as shown in Figure 7. The hot cracking susceptibility index (CSI) is defined as the maximum value of -dT/d(fs)1/2with (fs)1/2 < 0.99.
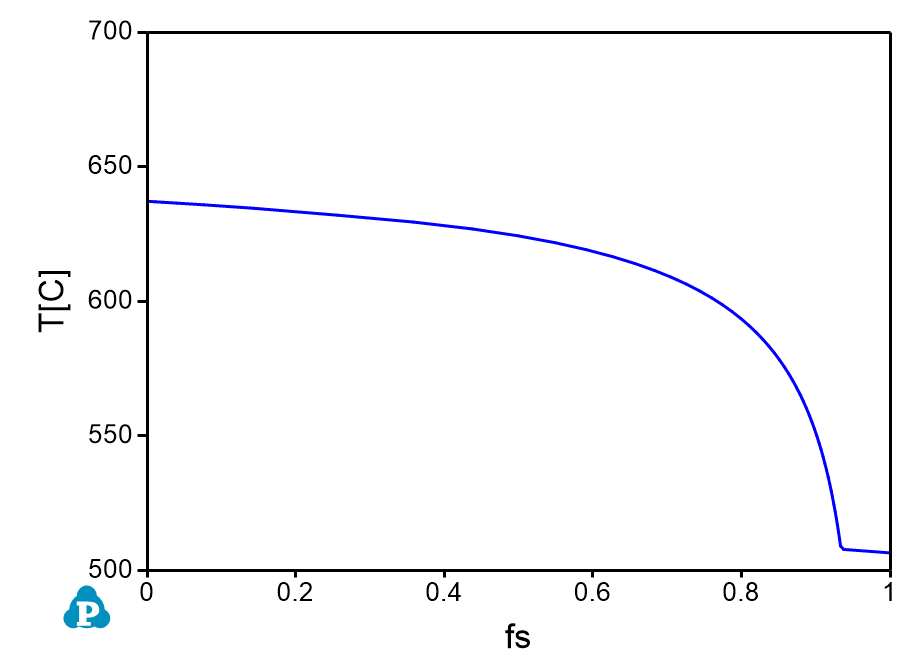
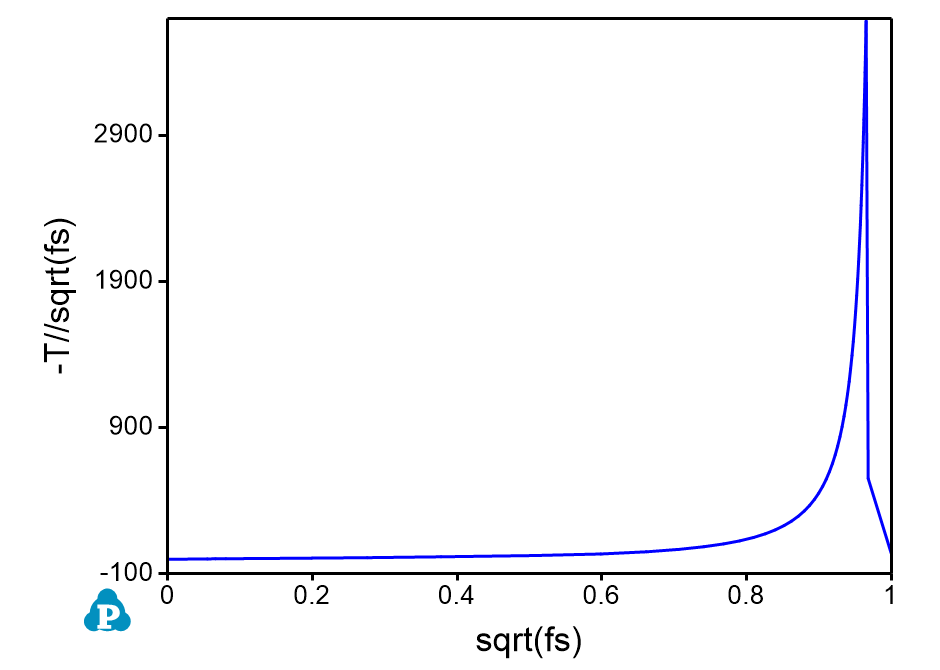
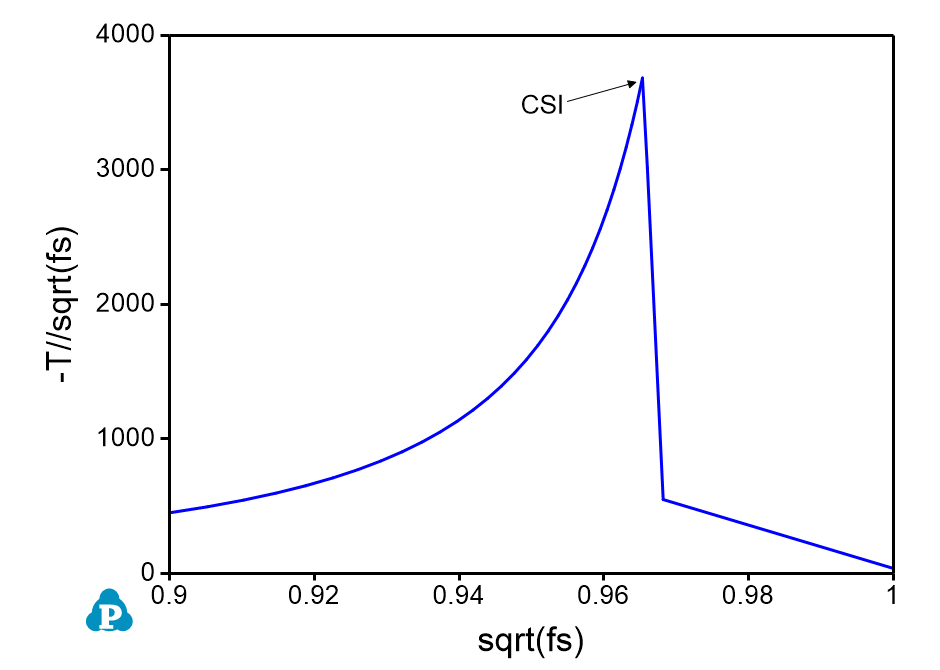
Figure 7: Rescale of Figure 6 showing the maximum point of -T//sqrt(fs) with sqrt(fs) < 0.99.